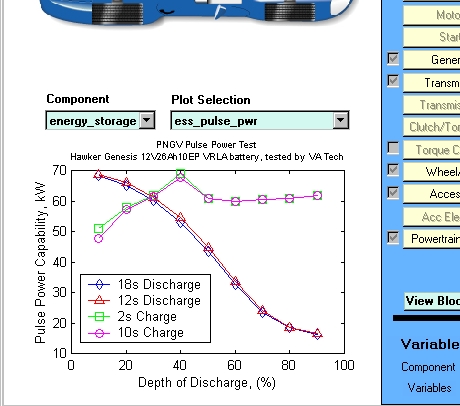
Figure 1: Sample PNGV Pulse Power Plot
A PNGV Pulse Power plot has been added to the menu of energy storage system plots in v3.2. Please refer to the PNGV Battery Test Manual revision 3.0 for the background and application information for the Pulse Power profiles. The pulse power plot is different from the instantaneous power plot in that it includes a discharge or charge duration term. Whereas the instantaneous power plot simply looks at the voltage and resistance characteristics at a instantaneous point in time. It does not represent sustainable power performance. Also note that the results are plotted with respect to Depth of Discharge (DOD) rather than State of Charge (SOC).
Performance results are provided for both charge and discharge operations and for power assist (very little if any battery only operation) and for dual mode (ability to both load follow and provide electric only operation) type tests. The discharge power performance is determined by iterating on the constant peak power value that can be drawn from the batteries starting at the low soc setpoint (cs_lo_soc) for the specified duration (power assist = 18s, dual mode = 12s) without exceeding the minimum voltage limit (ess_min_volts). Likewise, the charge power performance is determined by iterating on the constant peak power value that can be absorbed by the batteries starting at the high soc setpoint (cs_hi_soc) for the specified duration (power assist = 2s, dual mode = 10s) without exceeding the maximum voltage limit (ess_max_volts). Figure 1 provides an example of the results plot. Note that since the battery model must be run to determine these results, the generation of the plot may take 30-60s. Be patient.

Figure 1: Sample PNGV Pulse Power Plot
* * * * *
Last revised: [8/20/01] tm