![]()
A program to automatically generate battery files for ADVISOR from test data.
![]()
A program to automatically generate battery files for ADVISOR from test data.
 Tutorial with
Sample Files
See plotting and processing of sample files to help you get your battery
data in the correct format.
Batmodel 2 divides the processing into two sections:
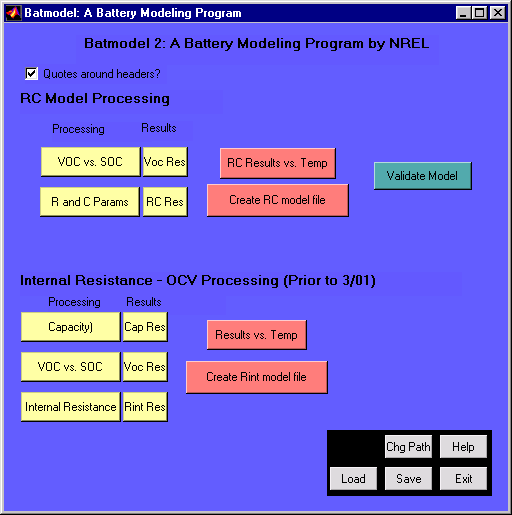
Internal Resistance - OCV Processing
This section processes data for Rint battery files. It is divided
into two main sections:
File Specification
The File Specification screen comes up when one of the 'Processing'
options (VOC, R & C Params, Capacity, or Rint) from the main screen
is picked. Here the user specifies the data files containing the test data.
The user may save results as one large file, or as many small files.

Data File Information
Once the test data files have been selected, the user inputs information
about the data files in the Data File Information screen. On the bottom
left the user is presented with the variables needed for data analysis.
The appropriate test data heading is matched to the variable on the left.
Specifying the appropriate headings is made easy with popup menus. Data
can be converted using mathematical expressions if it is not already in
the appropriate units and a sample conversion is provided on the right
for the user to confirm that the proper computation will occur.

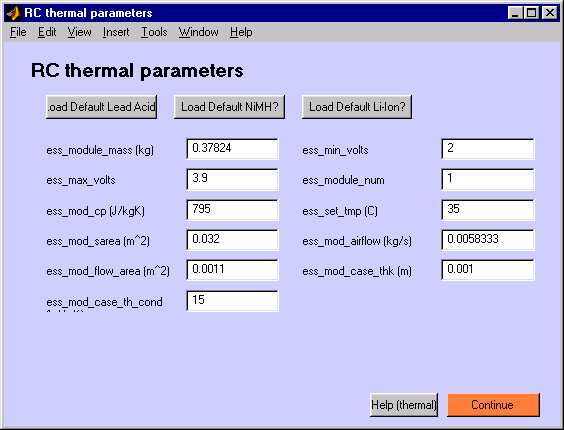
After all the information is filled in, the Process Data button is selected. For the VOC processing, the analysis runs and displays two results figures. For the 'R and C Params' generation, some more information about the thermal characteristics and voltage limits of the battery is obtained from the user.
Assumed Test Procedures/Results screens
RC Model
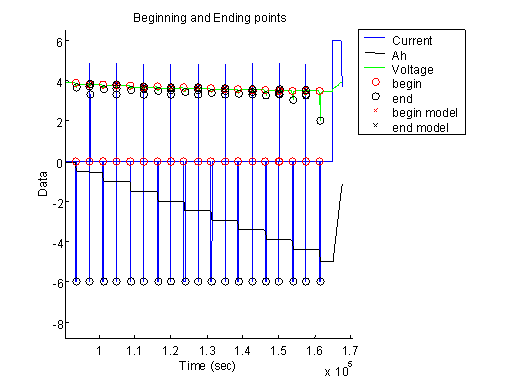
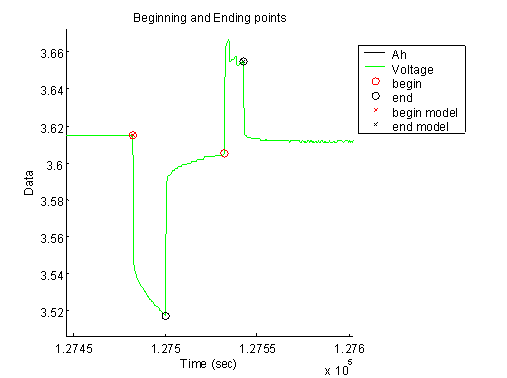
The graphs below display the time plots of the variables of interest,
e.g. current, voltage and amp-hours. As a data check, the user can see
which actual data points were selected for the analysis.
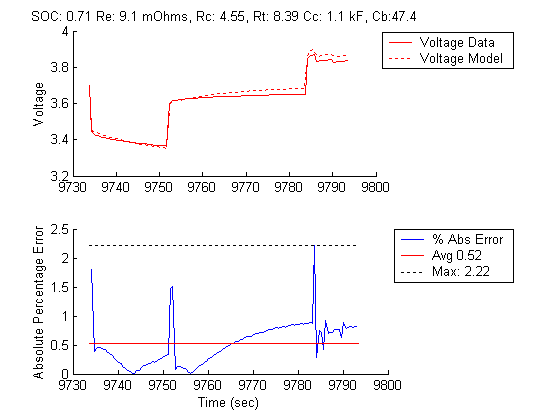
Batmodel2 creates initial guesses for the 5 parameters in the RC model, as described in the battery documentation. It then runs an optimization study based on a ± 10% deviation in these parameters and finds the best fit with the objective to minimize the average voltage error. The optimization algorithm used was 'Direct' from University of Michigan. The figure below shows an example of the voltage (data vs. model) over a single HPPC profile at 71% SOC. The associated absolute voltage error plotted below shows that the average error was 0.52%.
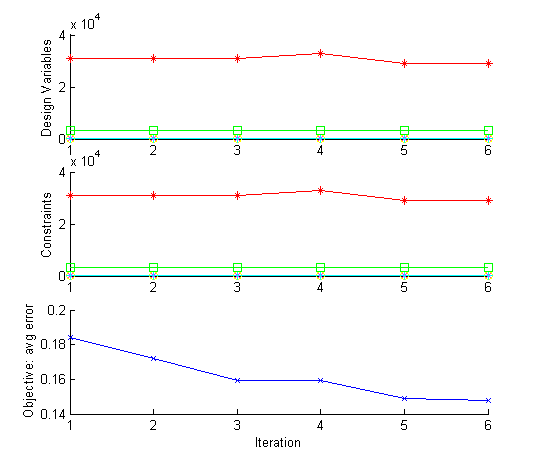
The figure below shows the optimization run for a second case. The bottom graph shows the objective function as it drops with number of iterations. Note that for each iteration, a direction to travel, in terms of the newly set values of the parameters, is chosen. For the first iteration, ~5 simulations were run, and for the last iteration, ~30 simulations were run. In this case, the optimization dropped the average error from 0.182% to 0.145%.
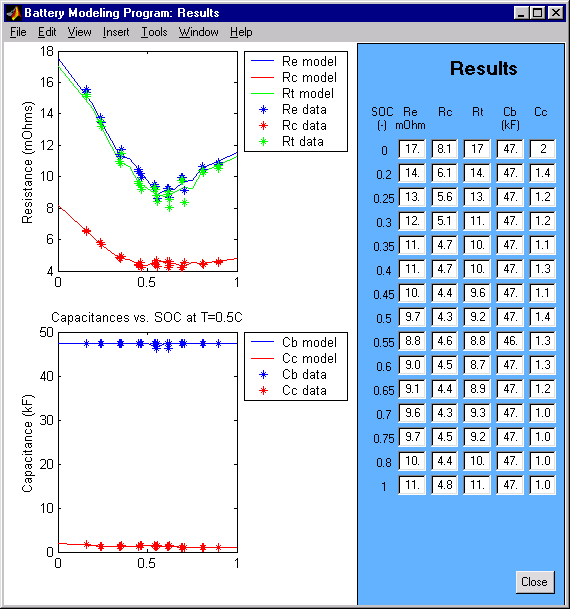
The optimization is performed for each HPPC profile, and the results are presented in the Results figure. From here, the user may edit any one of the parameters. The values for Re, Rc, and Rt vary with SOC in the RC model, but the values for Cb and Cc are constant. The optimization verifies this behavior, as the capacitors are constant across SOC values. The final ADVISOR model uses the average of these capacitor values.
Once battery data is processed with Batmodel2 for various temperatures, the user can plot the parameter variation with temperature and then generate an ADVISOR battery file.
Rint Model
1. Rate vs. Capacity Testing
ADVISOR previously (prior to August, 1999) used this modified form of the Peukert equation:
![]() Equation 1
Equation 1
where I is current (A), Capacity is battery capacity (Ah), Coeff is a constant coefficient, empirically derived, and Exp is a constant exponent, empirically derived. Again, in the current form of the ADVISOR battery model, Peukert information is not needed.
Batmodel Assumptions with the Capacity Tests

The figure below shows a typical output for a Peukert/residual capacity test. The maximum capacity for this battery was ~7 Ah.
NREL performs OCV tests as successive discharges of the battery at 20% SOC increments and one at 10% SOC, and then rest periods of one hour in order to determine the OCV as a function of SOC. These tests were normally run at the C rate, with additional tests performed at lower rates if time permitted.
Batmodel Assumptions with the OCV Tests


3. Internal Resistance vs. SOC
In ADVISOR, the battery is modeled as an equivalent circuit with no frequency-dependent resistance, as shown below.

The internal resistance (Rint) parameter in ADVISOR is not the same as a static impedence (high frequency) measured with an ohm-meter across a batteryís terminals. ADVISORís internal resistance is intended to account for the full voltage drop experienced by a battery from its equilibrium open circuit voltage to the terminal voltage that is seen under load. Rint is assumed to be dependent on both SOC and the direction of current flow.
To determine the internal resistances, a series of pulses of constant current should be applied to the battery, monitoring the voltage response. An example of the voltage response to a current pulse is shown below. V1, V2, and V3 in Figure 2 are easily measured, but Vfuzzy could not be easily measured. A few assumptions about the battery and model are used to determine Vfuzzy. Both the open circuit voltage and the resistance are assumed to be constant over the pulse period such that the DV at the beginning of the pulse is the same at the end of the pulse. Looking at Figure 2, this means that DV=V1-Vfuzzy=V3-V2. The 18 second pulse length was based on two factors: 1) the PNGV Battery Test Manual suggests an 18 second pulse for resistance characterization, and 2) 18 seconds was sufficient time for most of the transient behavior of most cells to die away.

The starting equilibrium voltage of the battery is correlated to SOC, and the effective resistance of the battery is determined according to the following equation:
where V2 and V3 are the voltages shown, and I is the current.
It should be pointed out that although our testing procedure is similar to the PNGV Battery Test Procedure, it is different. Our procedure is in line with the method to provide models for ADVISOR.
Typically, Rint testing at NREL consists of discharge pulses, then constant discharges to take the battery down to a desired SOC, where another pulse is applied. A similar approach is used for charging. If the discharge rate is large enough to drop the SOC, no intermediate discharge is used.
Batmodel Assumptions with the Rint Tests
![]() Equation 3
Equation 3
By clicking checkboxes, the user also has the option to plot the resistance data in groups joined by lines where each group has a particular current associated with it. In some battery technologies, internal resistance data can depend substantially on the current being drawn.
The figure below displays the time plots of the variables of interest, e.g. current, voltage and amp-hours. The user can also see which actual data points were selected for the analysis, and which points were discarded due to data quality constraints mentioned above.

Results vs. Temperature
Once battery data is processed with batmodel for various temperatures
(and saved as mat files), the user can plot the parameter variation with
temperature and then generate an ADVISOR battery file. The plot below shows
an example of the capacity data variation vs. temperature.

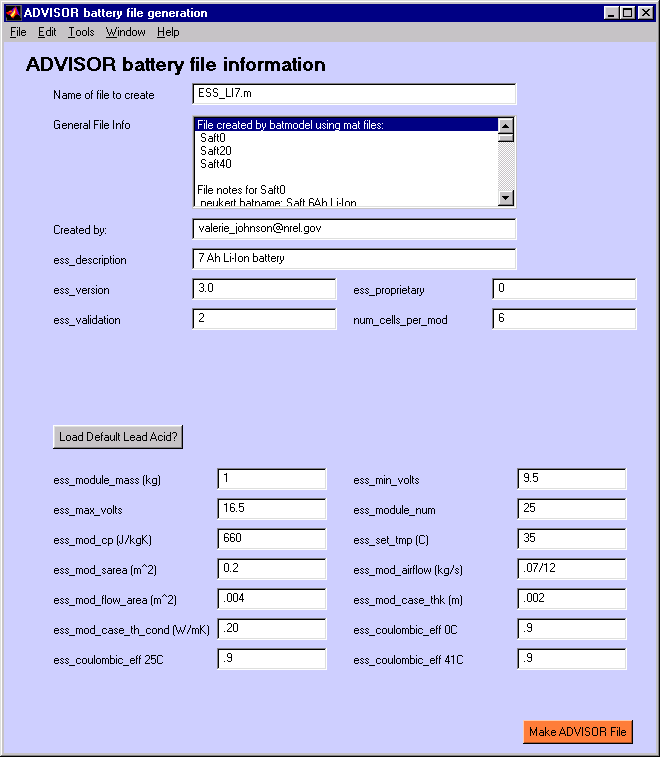
ADVISOR Model Generation
RC Model
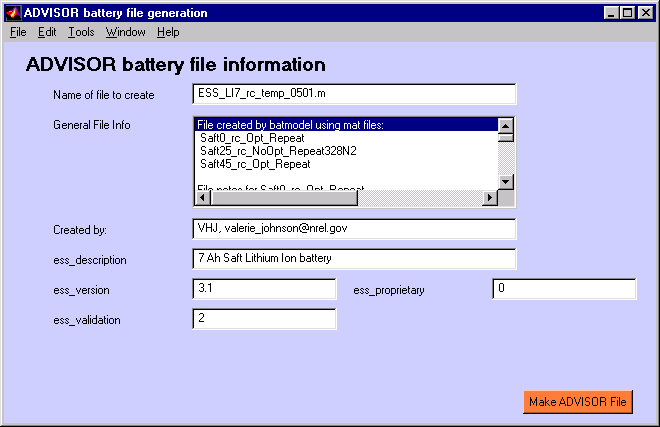
The user can automatically create and ADVISOR battery file once the
user has a complete mat file for at least one temperature. The data files
used and accuracy/error data from the processing is automatically saved
in the header.
Validation
RC Model
The user can automatically validate an ADVISOR battery file against
a set of test data.
First, the user is prompted for ADVISOR RC Battery file.

Next, the user is promped for test data file.

The required format for the test data file is a mat file specifying
variables as follows:
| Variable Description | Variable Name |
| Time (sec) | t_data |
| Power (W) | pwr_data |
| Current (A) | current_data |
| Voltage (V) | volts_data |
| Amp-hours used (A-hr) | ah_data |
| Battery Temperature (C) | temp_data |
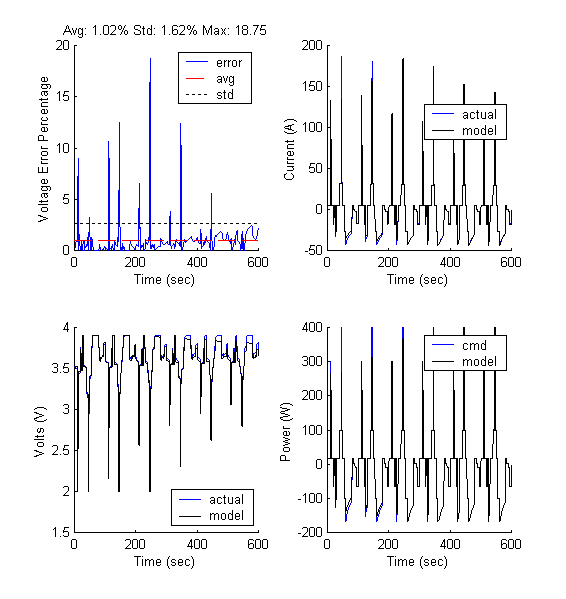
The results are plotted automatically, with voltage error vs. time and average/max values given.
