Comparing Simulations
Setup Description
The ‘Compare Simluations’ functionality allows the user to compare up to 8 simulations. The simulations must be previously saved ADVISOR runs. To save a simulation, choose ‘Save Simulation’ from the File menu on the main ADVISOR results screen. Simulations for different cycles or with different drivetrains may be compared. If the simulations are for different drivetrains, the list of available time plots is determined by the time variables of the first selected simulation. The Compare Simulations screen may be invoked for a single simulation.

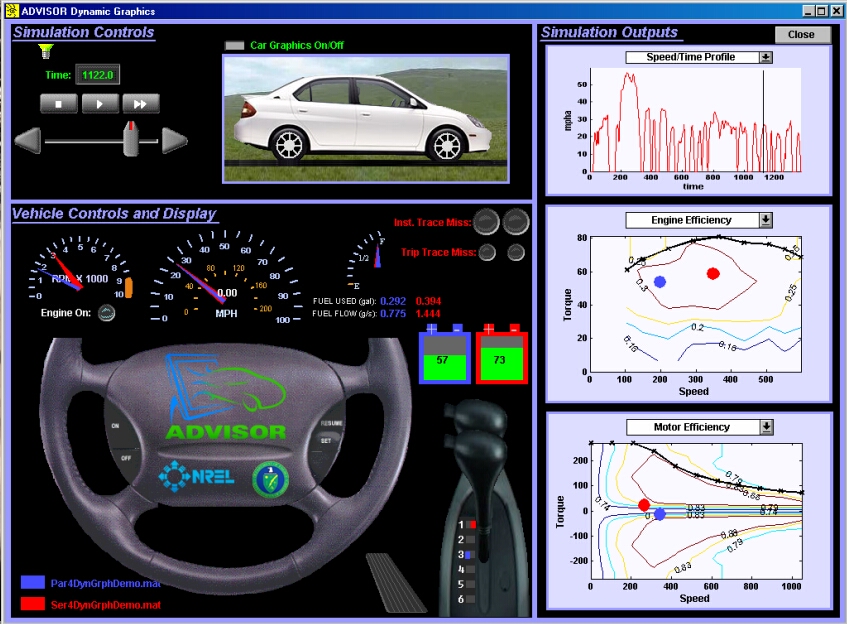
Results Comparison Screen (when Dynamic checkbox is picked)

Results Comparison Screen
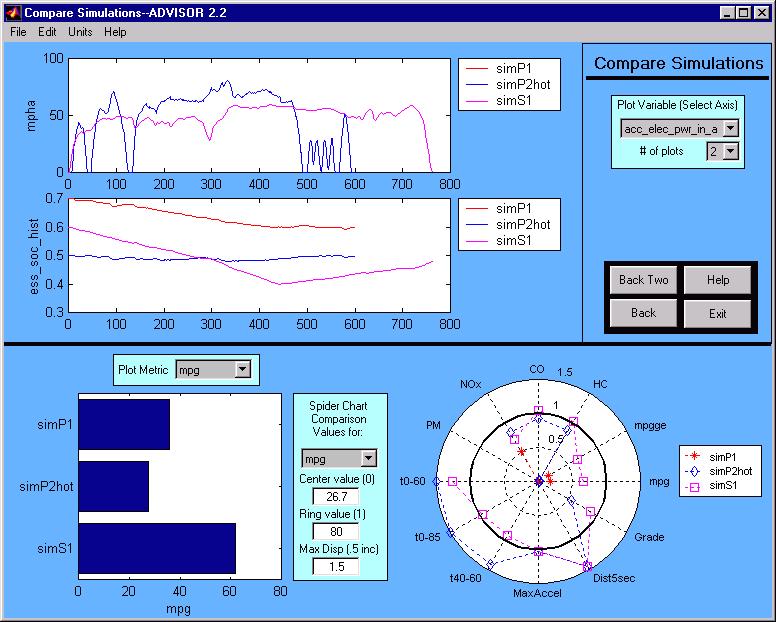
The Compare Simulations results screen is shown below. The time variables are plotted for each simulation.

Bar Chart
The metrics for the individual simulations are plotted on the bar chart.
Spider Plot
A spider plot is a way of comparing simulated results to desired targets. If the simulated result lies inside the band of value 1, the target was not met. If the result lies outside of the band, the target performance was exceeded. The value is calculated as follows:
Normalized value=(Original value-Inner value)/(Outer(at 1)-Inner)
The inner value is less than the outer if the goal is to maximize the variable (e.g. fuel economy). The inner value is greater than the outer value if the goal is to mnimize the variable (e.g. NOx emissions). The inner value is restriced such that there are no negative normalized variables. The 12 metrics shown, and their default targets are as follows:
These targets, or outer and inner values, can be changed by the user through the edit boxes. The spider plot’s outermost value displayed is adjusted with the Max Disp (maximum displayed) edit box. This can be adjusted in increments of 0.5.