Real World Test Procedure
Test Procedure Description
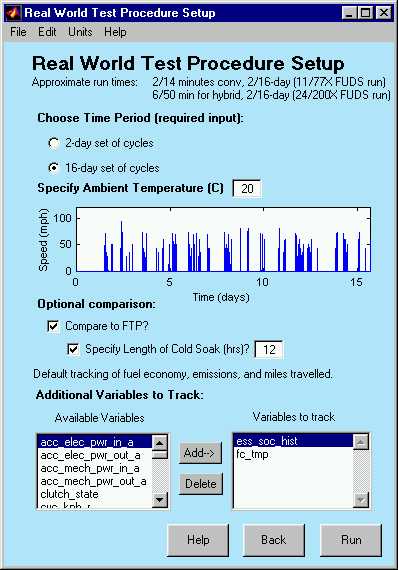
The Real World Test Procedure is intended to capture real-world driving patterns by running simulations and soaks over a period of several days. It is based on data available from CARB on real-world driving patterns. The setup screen shown below shows the various input options. The user can choose from a 2-day set of cycles, or a more comprehensive 16-day set of cycles. The user also specifies the ambient temperature during the entire test.
As a benchmark, the user can compare the Real-World results to FTP results. The user may specify the length of the cold soak between the preparation cycle (UDDS) and the FTP. The official test procedure specifies a soak period of 12-36 hours after the prep cycle. If this option is not checked, the FTP will run with no preparation cycle or soak, but with cold start initial conditions.
In addition to tracking the fuel economy, emissions, and miles during the set of cycles, the user has the option to track time variables. These are added by the user to the ‘Variables to track’ section in the setup screen.
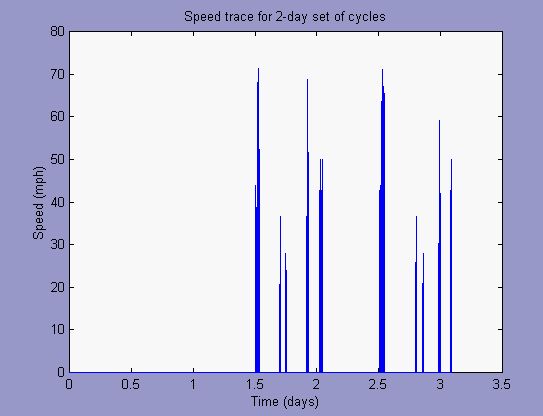
The initial conditions of the vehicle are set to hot, indicating that the vehicle had just stopped driving. The first soak is a 36 hour soak. The average velocity of the trips ranges from 5 mph to 75 mph. The 2-day option runs a set of 13 soak/driving trips. The total cycle is shown below:
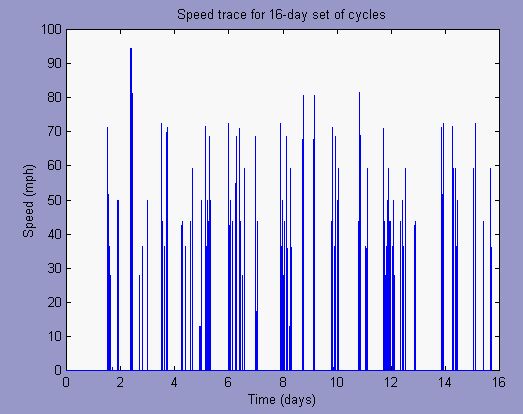
The 16-day option simulated 107 soak/driving trips.
Results
The Real-World results screen is shown below:
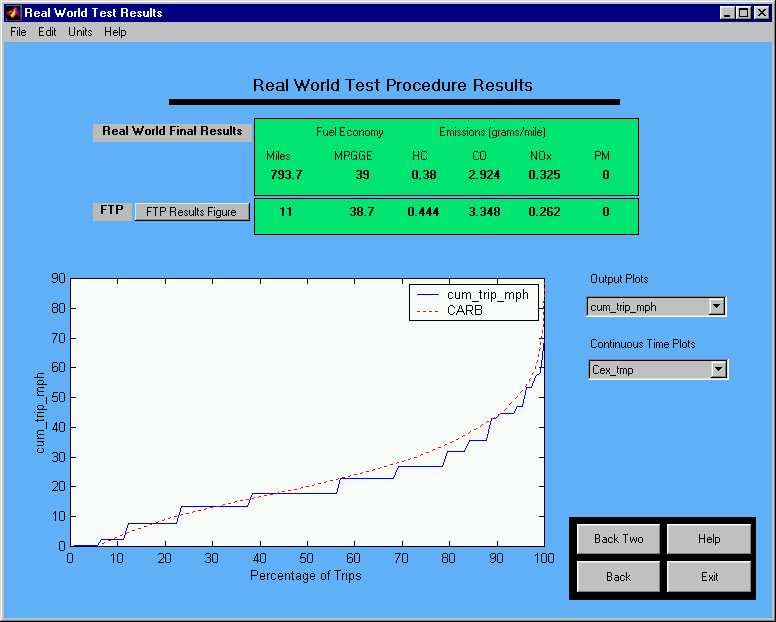
Real World Final Results
The final Real-World results presented are the raw distance, gas equivalent fuel economy/consumption, and emissions. If checked to run, the button for the FTP results pulls up the normal ADVISOR results screen for the FTP time history plots.
Output Plots
There are 8 generic output plots available:
Continuous Time Plots
The continuous time plots available are those variables selected by the user in the input screen. The variable name has a ‘C’ added to the beginning of the name to indicate that it is continuous through the entire 2 or 16-day set of cycles. Note for hybrid vehicles: it is useful to track SOC to observe the final value and compare to the initial value for the lengthy execution time of the test procedure means that ‘zero-delta’ SOC correction is not employed.