Creation and Validation of a
New Automatic Transmission Model in ADVISOR
August, 2000
Nomenclature
K: K factor, defined as win/(Tin)0.5
K_ADV: ADVISOR K factor, defined as wout/(Tout)0.5
SR: Speed Ratio, defined as wout/win
TC: Torque Converter, or hydrodynamic torque converter
ADVISOR previously had an automatic transmission model in ADVISOR that was based on algorithms that were developed by J. D. Murrell & Associates under subcontract to Argonne National Laboratory, as presented in JDMA’s “Drive_line” simulation program dated May 1998. Several problems were encountered with the implementation of this model in ADVISOR, including:
In an effort to increase the robustness of the automatic transmission model in ADVISOR, NREL collaborated with an industry partner to develop a new automatic transmission model. This report describes development of the new model and validation of the model on a truck over an acceleration test.
The Backward Facing Torque Converter Model
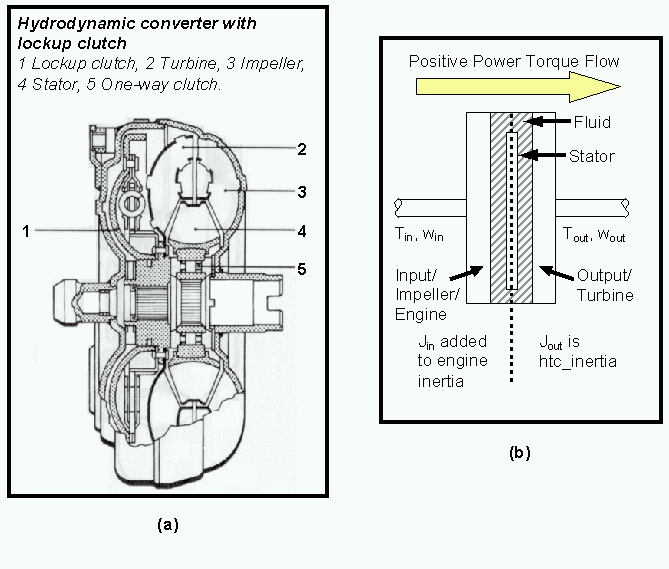
A cross-section and a schematic of a typical hydraulic torque converter are found in Figure 1.
Figure 1: Cross-section (a) and Schematic (b) of a Torque Converter
In creating the backward torque converter model for ADVISOR, some assumptions about the TC operation are made (e.g. that the desired performance will be met). If engine limits are reached further down the simulation path, this information is passed back to the TC model through the backward path. This feedback is used to minimize errors in the model.
There is one assumption of backward model, however, that is not present in a forward model. Instead of meeting torque request first, the torque is used to overcome inertia and spin up the turbine, then the extra torque is passed along to the driveline. A forward model would assume that the torque is first supplied to the driveline, then the extra available torque is used to accelerate the turbine (thus increasing the speed ratio). This behavior could lead to the backward model predicting higher efficiencies (SR is higher), or slower accelerations (torque available is lower).
Two approaches were considered in modeling the torque converter. The first was aimed at making the backward model similar to a forward model. This approach required many assumptions about the torque converter operation, and was considered too restrictive, particularly in reference to the speeds of the TC.
In order to eliminate the assumptions about speed of the TC, and to use all the information available in the backward model, an alternate K factor was chosen to represent the behavior of the torque converter. This K_ADV factor was defined as follows:
 Eqn. 1
Figure 2 shows the Torque Ratio (TR), Efficiency (=SR*TR), K factor, and K_ADV. Note that the K_ADV curve is not flat, or constant, with speed ratio. Therefore, using K_ADV to predict the SR and TR of the torque converter will not result in efficiency errors.

Figure 2: 10.75", 144K Torque Converter TR, K and Efficiency vs. SR (0-1, driving)
The K_ADV factor was also used to predict speed and torque during coasting. The Torque Ratio (TR), Efficiency (=SR*TR), K factor, and K_ADV for SR>1 is shown in Figure 3. The coasting data shown below is typical of a 10.75" torque converter

Figure 3: 10.75" TC. TR, K and Efficiency vs. SR (1-20, coasting)
The model (shown in Figure 4) incorporated the following aspects:
Figure 4: New Torque Converter Model in ADVISOR
Validation of TC Model with a Truck over an Acceleration Test
Presented below are ‘old’ and ‘new’ simulation results of a truck on an acceleration test. The old simulation results came from model and test comparisons with the old automatic transmission model. The new simulation results are from ADVISOR predictions with the new torque converter model.
Description of the modeled vehicle:
For agreement with the test data several model assumptions were changed. These include:
In the following graphs, ‘Old Model’ refers to the previous ADVISOR torque converter model based on Dill Murrell’s work. ‘New Model’ refers to the new model under initial development. ‘New Model #2’ refers to the most recent model developed. Updates to the torque converter model for ‘New Model #2’ include the following:
Figure 5, Figure 6, and Figure 7 show the speed during a maximum acceleration of the vehicle. The agreement between the data and the model for both models is seen to be excellent.

Figure 5: Old Model vs. Data, MPH

Figure 6: New Model vs. Data, MPH

Figure 7: New Model #2 vs. Data, MPH
Figure 8, Figure 9, and Figure 10 show the maximum acceleration of the vehicle during the acceleration test.

Figure 8: Old Model vs. Data, Acceleration

Figure 9: New Model vs. Data, Acceleration
A comparison between the acceleration graphs for the Old and New models shows the following:

Figure 10: New Model #2 vs. Data, Acceleration
The New Model #2 in Figure 10 shows the following enhancements to the New Model:
ADVISOR does not allow the negative torque from slowing the engine down during a shift to reach the torque converter if the requested speed is not being met (see the “>=0 saturation block in fc/engine torque/effect of inertia”). This is why the jump in acceleration during the shift was smaller than observed—only the torque converter inertia torque was allowed to pass through to the vehicle. This TC turbine acceleration jump is shown in Figure 10.
In order to allow the engine inertia torque to reach the torque converter, the saturation block was removed, resulting in a slightly higher acceleration torque seen in the left graph in Figure 11. To get the acceleration jumps to agree between model and test data, the engine inertia needed to be increased 60% (note that this includes the impeller inertia).


Figure 11: New Model #2 vs. Data, Acceleration, Engine Inertia Torque passed during shifting (bottom: engine inertia increased 60%)
Figure 12, Figure 13, and Figure 14 show the engine speed during the acceleration test. Note that Figure 12 compares the test data to the estimated engine speed, not actual engine speed achieved.

Figure 12: Old Model vs. Data, Engine RPM

Figure 13: New Model #1 vs. Data, Engine RPM

Figure 14: New Model #2 vs. Data, Engine RPM
Figure 13 and Figure 14 also plot the speed out of the TC, showing smooth behavior.
The engine behavior in the models has the following characteristics:
Figure 15 shows the SR and TR in the simulation, as well as an estimated SR for the data. The estimated SR was found by:
 Eqn. 2
During shifts, a linear transition between gear ratios was assumed to occur over 0.5 seconds. The SR and SR_est have excellent agreement.

Figure 15: New Model vs. Estimated Data, SR and TR

Figure 16: New Model #2 vs. Estimated Data, SR and TR
The new model is more robust than previous model and more closely agrees with the acceleration test data. Vehicle speed was accurately predicted, vehicle acceleration was close to test data, and the SR behavior was consistent. The engine speed behavior with the new model is much closer to test data than with the old model, eliminating overshoot and undershoot of transient engine speeds, however the new model over predicts engine speed by approximately 10%.
The updated model (New Model #2) shows further refinements to the torque converter behavior. Coasting behavior is now included in the model. Acceleration behavior on launch more closely agrees with data due to engine speed estimator updates. Acceleration drop during shift was reduced to reasonable levels. Acceleration rise during shifts increased from Model #1. This was due to adjustment of the engine torque request during shifts. Acceleration jumps from dropping engine speeds during shifts are not allowed in ADVISOR currently. This restraint was temporarily lifted, and the acceleration was seen to increase. In order to get the peaks to agree, engine (plus impeller) inertia needed to be increased 60%.
Remaining issues to be addressed in the torque converter model include:
Last Revised: 8/10/00: vhj